Correlate agent runs, model calls, and tools
- Author
 Gregory MostizkySoftware Engineer
- Published
- Section
- AI Agents
- Length
- 6 min read3 sources cited
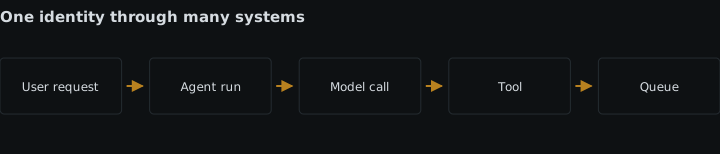
Use a business operation ID to join retries and replacement runs, and a trace ID to join telemetry within each distributed execution. Propagate both explicitly through model, tool, and queue calls. Keep every identifier opaque and free of customer data so logs and headers remain safe.
Prerequisites
Identify where a business operation begins and which failures create a retry, a replacement agent run, or a new operation. You also need control over the metadata sent with tool requests and queued work. Without those boundaries, code cannot decide which identifier to preserve and which one to replace.
Steps
-
Define two correlation lifetimes
Give each business operation an application-defined
operation_id. Keep it unchanged while the system retries a model call, retries a tool, starts a replacement agent run, or resumes the same requested outcome through another worker.Give each distributed execution its own trace ID. A trace ID joins spans and other telemetry produced inside that execution; it should not be stretched across separate replacement runs merely to make a search convenient. OpenTelemetry’s trace concepts describe a trace as the path of a request, assembled from spans that share a trace ID and express their hierarchy with parent IDs (accessed 2026-08-26).
The distinction is operational:
Identifier Preserve across Replace when operation_idModel retries, tool retries, queued stages, replacement agent runs A new requested business outcome begins Trace ID Model calls, tool calls, and services inside one distributed execution A separate replacement or resumed execution begins If a failed run is replaced, the old and new traces therefore have different trace IDs but the same
operation_id. That lets an operator inspect either one execution or the whole chain of attempts. It also gives agent run replay and debugging a stable key for finding every run associated with the outcome. -
Generate identifiers that disclose nothing
Make both identifiers opaque. Do not embed an email address, tenant slug, customer number, prompt fragment, file path, ticket title, or other customer data. Correlation values travel widely: they appear in logs, trace exports, request headers, queue metadata, error reports, and support tooling. Opaque values are safe to copy between those locations without turning the identifier itself into customer data.
Use your tracing library to create standards-compliant trace and span identifiers. The W3C Trace Context Recommendation dated 23 November 2021 defines the
traceparentHTTP header as version, trace ID, parent ID, and trace flags; its version 00 format uses a 16-byte trace ID and an 8-byte parent ID. Do not constructtraceparentby concatenating your own fields.Generate
operation_idindependently and treat it as an application field, not as a substitute fortraceparent. If the runtime already assigns an agent-run identifier, retain it as another searchable field, but do not make it carry both operation and trace semantics. -
Start one trace for the current execution
At the agent entry point, accept an existing trace context when the caller is part of the same distributed execution; otherwise start a new trace. Attach
operation_idto the root span and to the structured logging context.Create child spans around the units an operator must distinguish: the agent run, each model call, and each tool invocation. Keep model and tool activity in the same trace when they belong to that execution. This preserves ordering and parent-child relationships without asking log search to reconstruct them from timestamps.
Use established semantic names for model and agent telemetry where your instrumentation supports them. The supplied OpenTelemetry GenAI semantic-conventions index says, as accessed 2026-08-26, that the detailed conventions have moved and that the old page is no longer maintained. Follow its current destination when choosing exact attribute and span names instead of freezing names copied from an older implementation.
The cost is instrumentation work at every call site. The alternative—one span for an entire run—cannot show whether time and failure came from orchestration, a model call, or a tool.
-
Propagate both values through every tool boundary
Process-local logging context stops at the network hop. A tool service, subprocess wrapper, or remote worker cannot recover identifiers that were stored only in the caller’s thread-local, async-local, or request-local state.
Inject W3C trace context into the tool transport. For HTTP, that means the standard
traceparentheader andtracestatewhen present. Sendoperation_idseparately in an application-defined metadata field or header, such asx-business-operation-id. On receipt, extract the trace context before creating the tool span and placeoperation_idinto that service’s structured logging context.Apply this to both the request and the recorded result. A tool failure log that contains only a local request ID still leaves the operator unable to find the model decision that triggered it. Correlation does not replace validation of agent tool results; validation decides whether returned data may enter model context, while identifiers explain which execution produced it.
-
Put correlation metadata in queued messages
Queue publication is another network boundary. Add the serialized trace context and
operation_idto the message envelope or message attributes before publishing. Do not rely on the producer’s logging context or on a queue-generated message ID.At the consumer, extract both values before logging or starting work. Continue the trace when the queued task remains part of the same distributed execution. When the message starts a replacement run or another separately traced execution, start a new trace, retain
operation_id, and record the causal relationship using the tracing facilities available in your stack. The operation ID is what makes all such traces discoverable as one business history.A redelivery of the same queued task is not automatically a new business operation. Preserve
operation_id; decide whether to continue or replace the trace according to whether your system treats that delivery as the same execution or a new attempt. Make that rule explicit beside the retry policy. -
Keep the operation ID through fallback and recovery paths
Audit every branch that can replace work: model retry, fallback model selection, tool retry, queue redelivery, timeout recovery, and a newly scheduled agent run. Each branch must copy
operation_id. Each genuinely separate execution must receive a new trace ID.Record both identifiers on terminal events such as completion, cancellation, and failure. This yields two useful queries: trace ID answers “what happened inside this execution?”, while operation ID answers “which executions tried to complete this requested outcome?” Mixing those questions into one identifier makes replacement runs look like missing spans or makes a single trace span an arbitrarily long period.
-
Test propagation at the boundaries, not only in one process
Run one operation that crosses a model call, a remote tool, and a queue. Confirm that all spans inside the first execution share its trace ID and that logs at each component carry the same
operation_id.Then force a replacement run. Confirm that it receives a different trace ID while retaining the original
operation_id. Search by each value separately: the trace query must return only its distributed execution, and the operation query must return both attempts.Finally, inspect raw headers, message attributes, and exported logs. The values must be opaque and contain no customer data. Apply the same deletion and access rules used for the surrounding telemetry; agent data retention boundaries still govern logs, traces, and tool results even when their correlation keys are safe.
Expected result
A completed implementation has one opaque business operation ID spanning retries and replacement agent runs, plus a separate trace ID for each distributed execution. Model calls, tool invocations, queue consumers, logs, and terminal events carry the appropriate values explicitly. A trace-ID search reconstructs one execution; an operation-ID search returns every execution that attempted the same outcome.
Sources
- OpenTelemetry’s trace conceptsopentelemetry.io
- W3C Trace Context Recommendation dated 23 November 2021w3.org
- OpenTelemetry GenAI semantic-conventions indexopentelemetry.io
See also
How to attribute agent cost and latency to the task that caused it using per-task traces, per-call spans, and cache-aware token accounting.
Choose cron, event-driven triggers, or both by weighing execution frequency, detection delay, duplicate delivery, bursts, and repair.
How to quarantine repeatedly failing agent jobs, preserve evidence for diagnosis, and replay them only after the failure condition changes.
Pin the whole agent runtime, verify provenance, and route dependency updates through a tested release lane the running agent cannot bypass.